> For the complete documentation index, see [llms.txt](https://docs.adlibertas.com/llms.txt). Markdown versions of documentation pages are available by appending `.md` to page URLs; this page is available as [Markdown](https://docs.adlibertas.com/the-platform/how-it-works.md).
# How it works
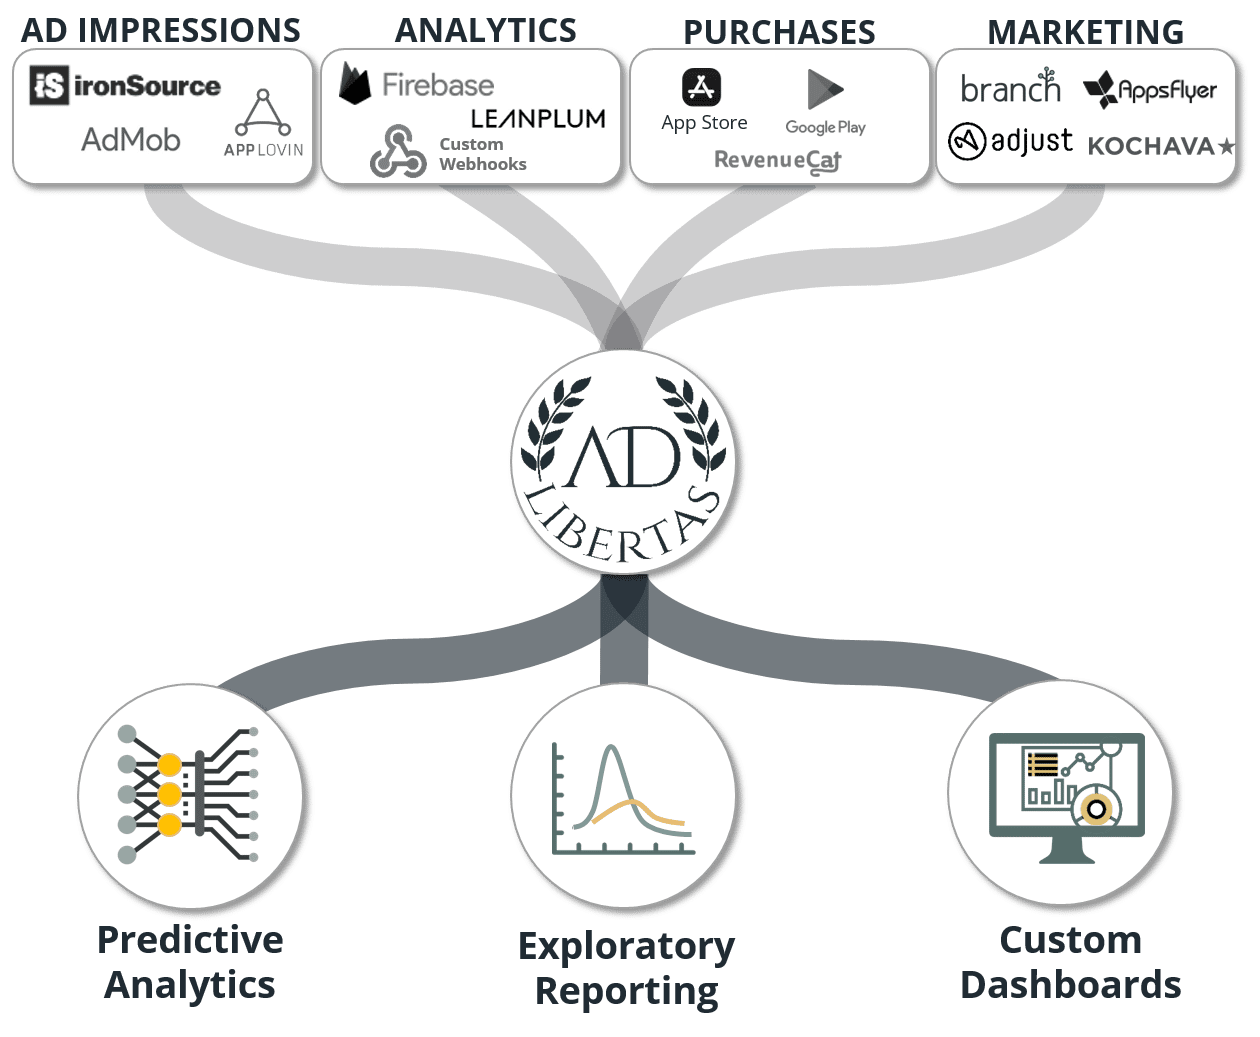
### **Step 1. API Data Collection**
We have 100+ APIs that are scheduled to batch-fetch your data from all in-app service providers. We don’t require an SDK for integration, and most data can be collected by simply connecting credentials.
{% embed url="" %}
### **Step 2. Data Pipeline: Processing & Storage**
**Scheduled Data Import & ETL**
Our scheduled, overlapping data import schedules ensures the latest data available is accessible while back-fetching ensures any later-posted data is added to keep data access timely and correct.
We’ve pre-built the ETL & processing algorithms so there’s no need for you to wrestle with scripting your own.
**Fully managed data lake**
For every AdLibertas customer, we spin up a single-tenant AWS account to house and store your data. We’ve architected your data to be stored as ORC files in S3 buckets. This maximizes long-term cost-efficiency and maintains accessibility and security for all clients. There’s no maintenance or overhead needed.

**Building your own Data Pipeline: Best Practices**
For app developers that want to architect, build and maintain their own data architecture, AdLibertas Head of Architecture, Allen Eubank, [shares our experiences](https://www.adlibertas.com/mobile-data-architecture-and-data-pipeline/) in building a scalable, reliable data pipeline.
**Fast, parallel-distributed query processing**
For processing the many petabytes of information generated by our clients, we adopted *Trino* a fast, highly parallel, and distributed query engine that is built from the ground up for efficient, low latency analytics at scale.
[Read how and why](https://trino.io/users.html#adlibertas) AdLibertas uses *Trino* to enable their customers.
{% embed url="" %}
### **Step 3. End-User Reporting & Access**
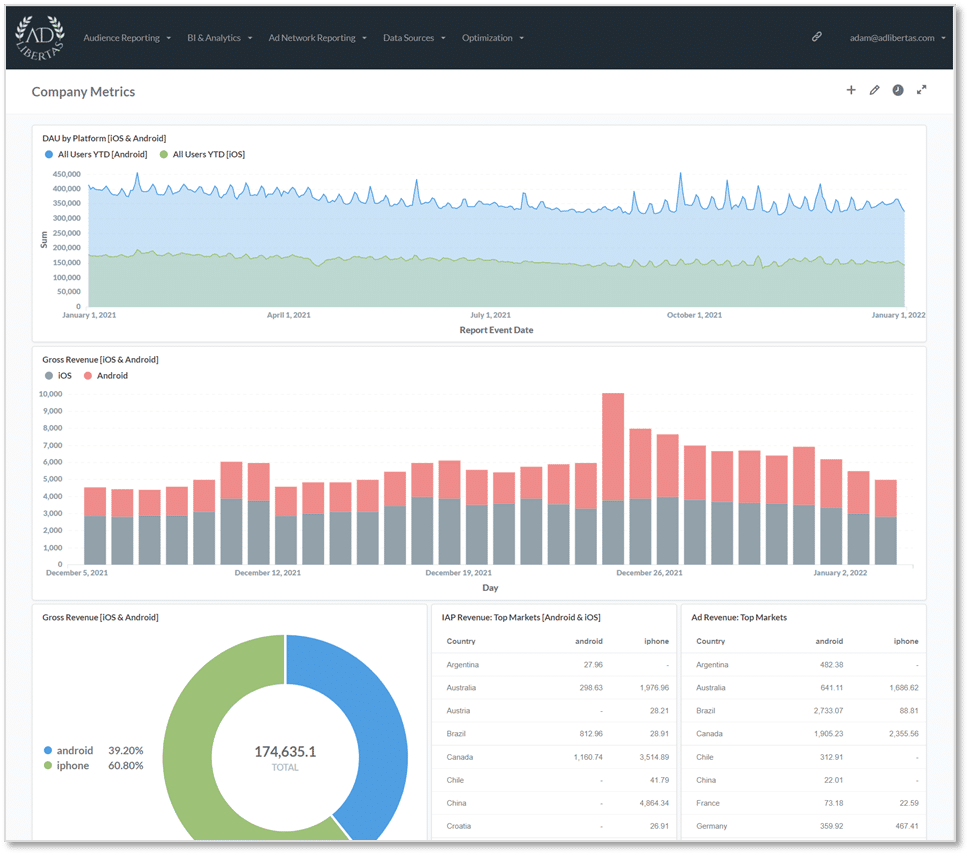
**Rich, interactive reporting and custom dashboarding**
**Self-service no-SQL exploration**
Our analytics give all users in your organization the ability to build custom-defined user datasets, defined by user-events, actions, and/or user characteristics. There’s no need for complicated SQL-joins or custom Tableau reports, anyone can simply drag and drop user-audiences. This gives your organization complete control and flexibility in refining their data-sets to find the important users and actions in your app.
{% embed url="" %}
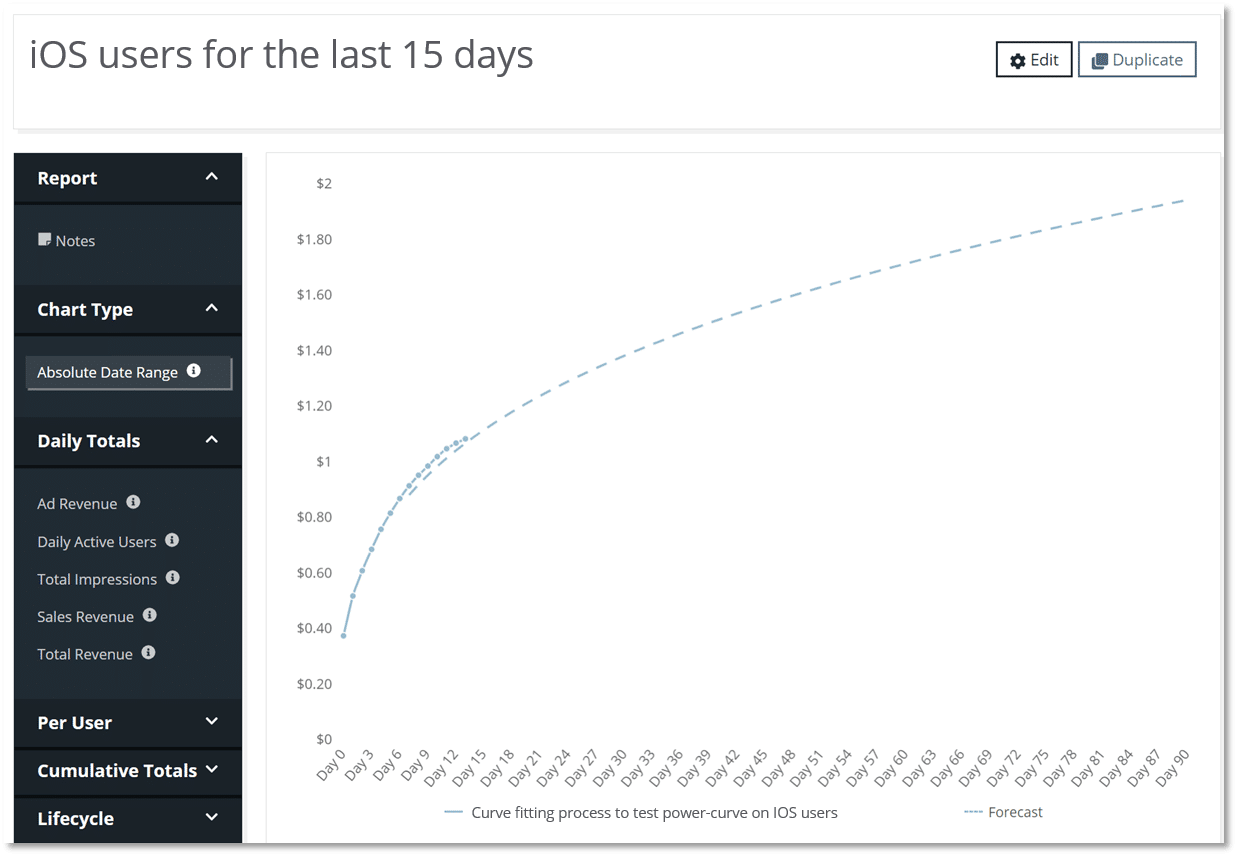
**Interactive, custom reporting & prediction models**
Your organization can compare audience datasets across performance metrics and custom events. See the [article on how predicted LTVs work here](https://docs.adlibertas.com/the-platform/user-level-audience-reporting/forecasting) and see how our proprietary machine learning predictions can help you get fast, accurate campaign predictions here
**Direct SQL Access & Custom Processing**
For customers who want direct access to the data, we offer direct [SQL access via Amazon Athena](https://www.adlibertas.com/supporting-amazon-athena-access/), or end-points to [access and download reports.](https://docs.adlibertas.com/the-platform/business-analytics) Additionally, customers can spin up their own computing clusters to run advanced or custom models against their users or custom datasets.
### Reporting Workflow
[**User-level Audience Reporting**](/the-platform/user-level-audience-reporting.md) allows you to create hyper-specific reports on user-level characteristics and behavior. From here, we store these reports in the [analytics](/the-platform/business-analytics/analytics-layout.md) system -- accessible via the "[Explore Data button](https://docs.adlibertas.com/the-platform/business-analytics/understanding-the-explore-data-button)"-- so you can add them to a [custom dashboard](https://docs.adlibertas.com/the-platform/custom-dashboards) or compare them against other user-level reports.
[**Consolidated Revenue Reporting** ](/the-platform/consolidated-revenue-reporting.md)allows you to view your earnings in [pre-built charts](https://docs.adlibertas.com/the-platform/consolidated-revenue-reporting#rich-reporting-built-for-ad-supported-apps) or drill directly into [analytics](/the-platform/business-analytics/analytics-layout.md) to create your own reports.
[ ](https://www.adlibertas.com/knowledge-base/adlibertas-audience-reporting/)