> For the complete documentation index, see [llms.txt](https://docs.adlibertas.com/llms.txt). Markdown versions of documentation pages are available by appending `.md` to page URLs; this page is available as [Markdown](https://docs.adlibertas.com/the-platform/exporting-data/chart-reports.md).
# Chart Reports
### Customized downloadable charts
*Customize, schedule, deliver!*
Located:
BI & Analytics > [Download Reports]() > Chart Reports


The purpose of the daily chart reports is to deliver high-level views of your overall consolidated revenue performance on a periodic timeframe. These charts won't answer all questions but they'll instead provide indicators of shifting performance. For more detail click on any image to visit the dashboard and drill into more results.
The data collected from these reports come from[ Consolidated Revenue Reporting:](/the-platform/consolidated-revenue-reporting.md) from the platforms that report on your revenue.
**Note on delivery:** If reports aren’t yet available at scheduled delivery time (customizable but by default, 9A PT), you’ll get a notification that reporting isn’t yet available. If reporting changes +/- 15% by EOD, you’ll get an updated chart at 17h PT.
### **The Main Report**
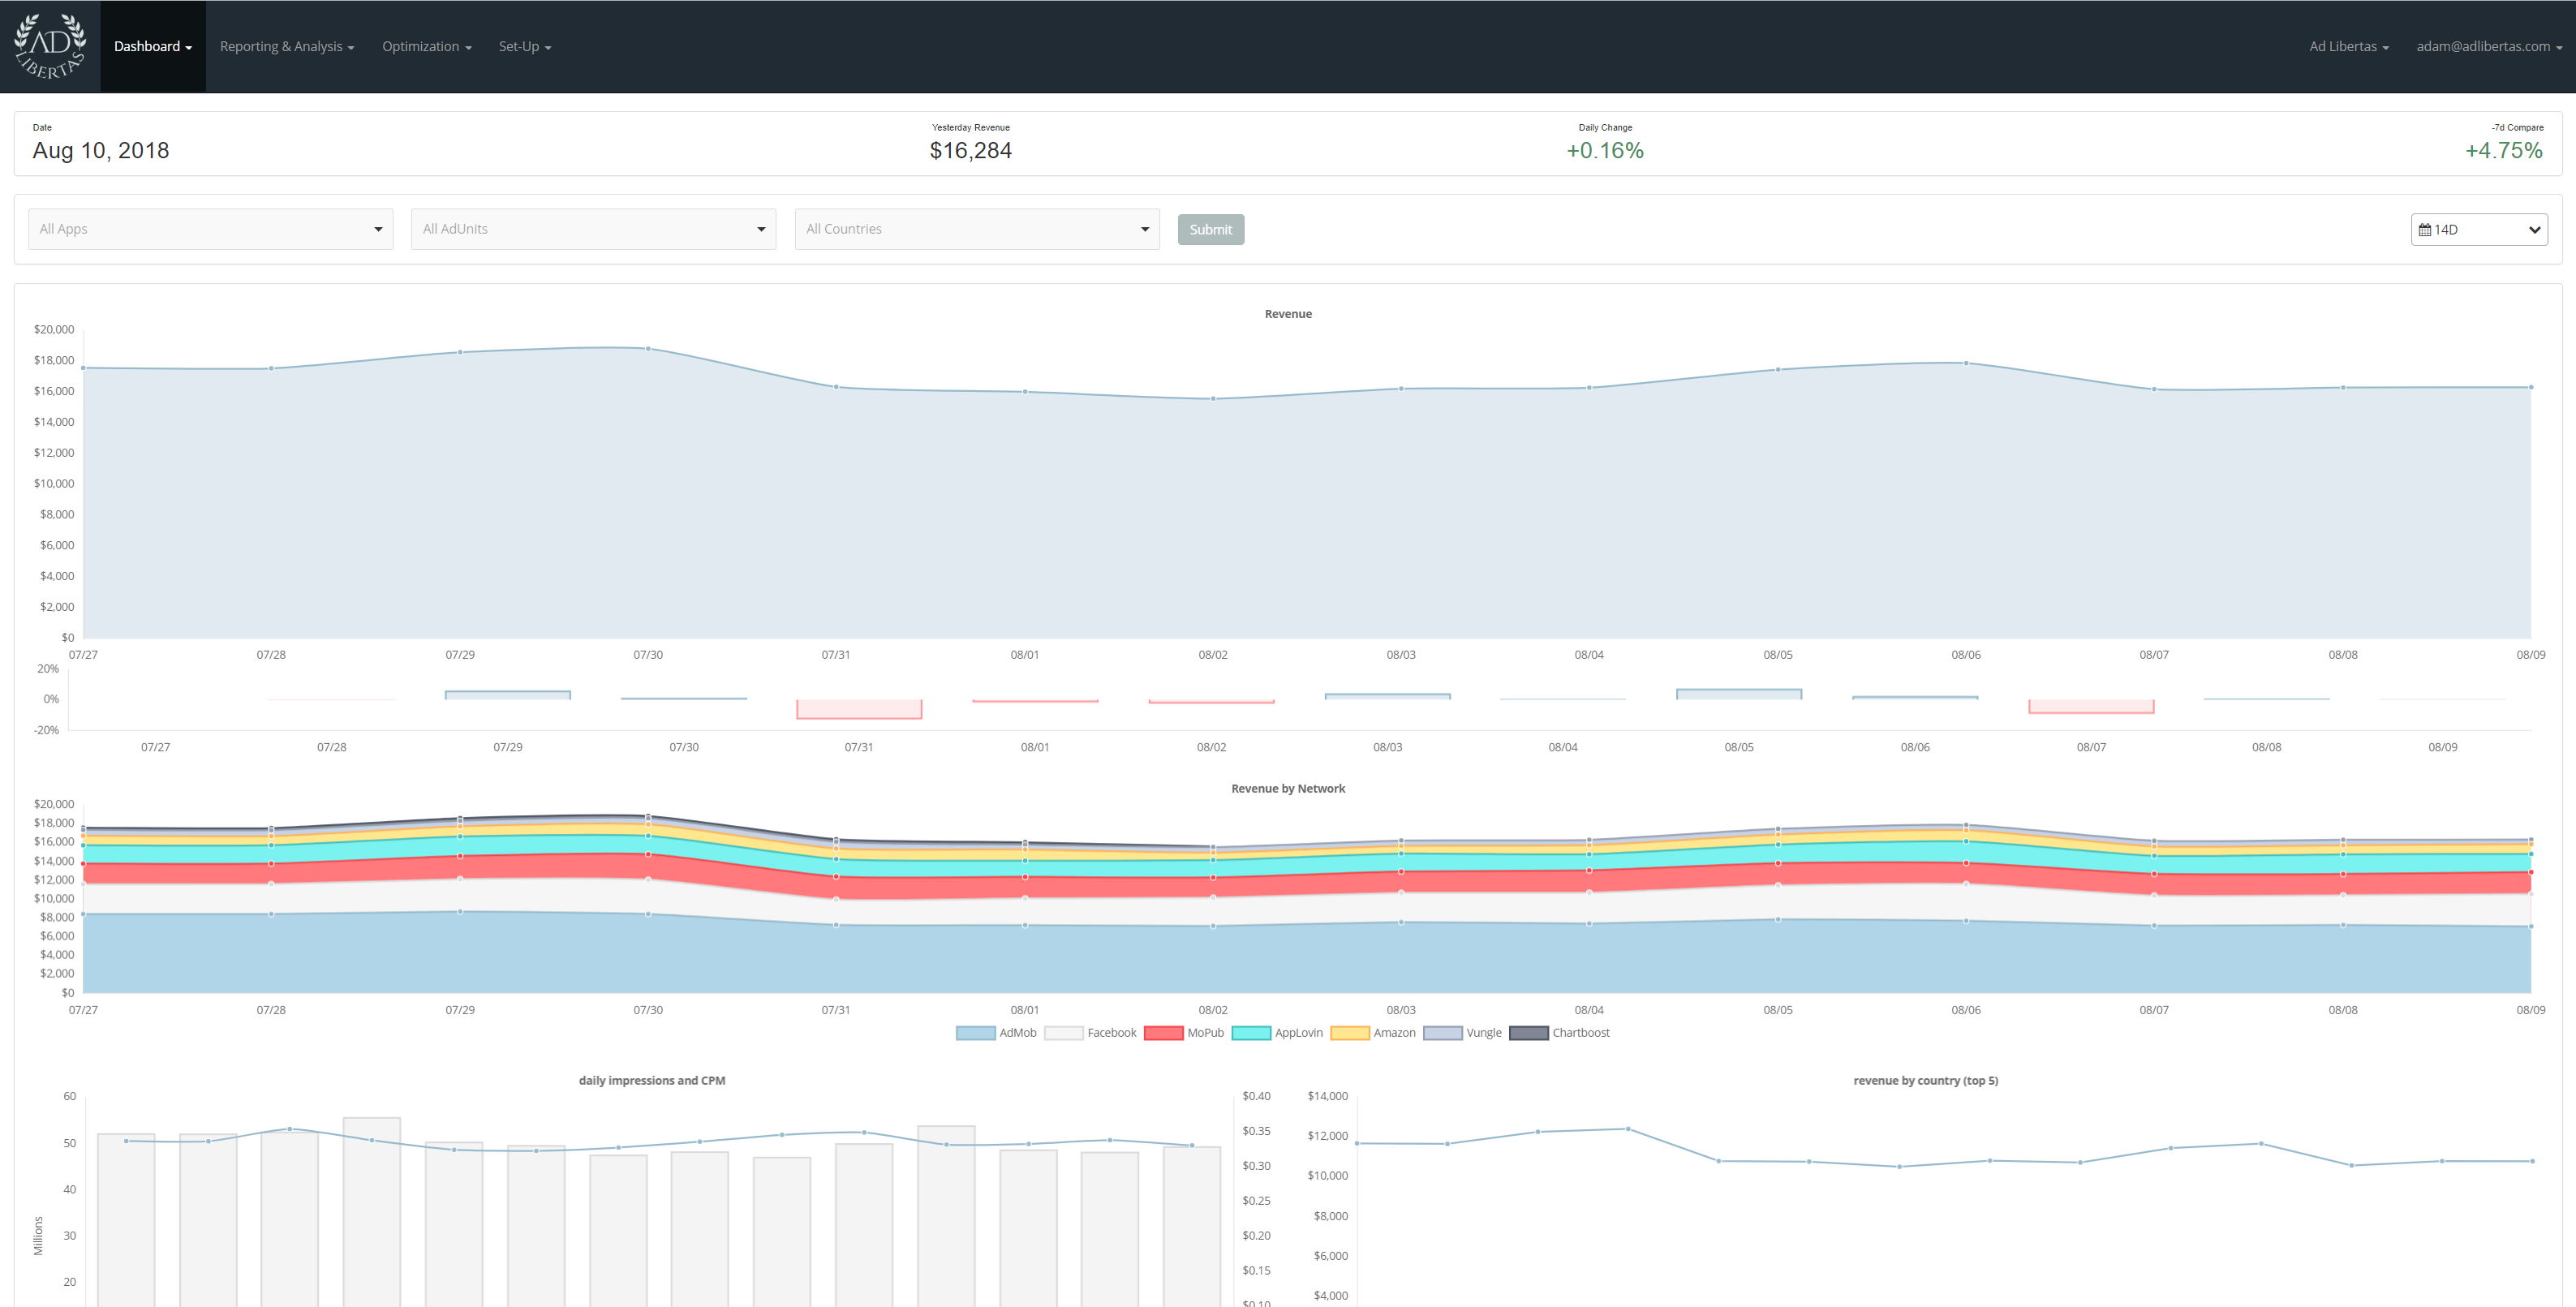
* **Yesterday’s Revenue:** Total aggregated revenue of the previous day’s aggregated network reporting.
* **DoD Change %:** Day-over-day change from yesterday’s earnings to the previous day as a percentage change.
* **7d Compare %:** Yesterday’s revenue as compared to the performance of one week ago – as a percentage.
* **Revenue:** Revenue trend-line over the selected period. Default is 14 days but you can alter the period delivered in the [reporting dashboard.](https://dashboard.adlibertas.com/reports)
**Network Performance:**

* **% Daily Change:** is the percentage change as compared to the previous day’s earnings.
* **Revenue by Network:** Stacked revenue by network, highest earnings bottom to top – limited to top 15. If you’d like more detail, click on the chart and you can isolate networks by clicking on the key.
**Impressions, CPM & Network Performance**

* **Daily Impressions and CPM:** dual-axis chart of impressions (bar, left axis) versus CPM (line, right axis).
* **Revenue by Country (top 5):** revenue contribution for the top 5 countries. To isolate, click through to our dashboard and click on the country key.
### Top Apps Report

The Top Apps Report is an optional add-on to the Chart Reports. This will summarize the ad revenue on your top apps.
To enable, enable the “Include Top Apps Report” checkbox when setting up a Chart Report. By default, this section will report on the top 5 apps by revenue.
* **Revenue by App:** Total ad revenue earned by app name.
* **CPM by App:** App CPM by app
* **Impressions By App:** Ad impressions served by app
* Revenue per Ad Request: Revenue earned per measured ad request
* Requests by App: Total ad requests measured per app
* Fill Rate by App: Ad impression per ad request per app. Note: depending on your platform, may include pre-cached but not served interstitials.
### ~~**DEPRECATED Daily Optimization Report:**~~
The Daily Optimization Updates are an optional add-on to the Chart Reports. This will summarize the AdLibertas optimization activity of your managed revenue.
To enable, enable the “Include Optimization Report” checkbox when setting up a Chart Report.
**Daily Optimization:**

The optimization header-bar is designed to show you the ebb and flow of optimization changes and tests that are happening in your managed traffic.
* **Waterfall changes:** Total daily optimized price points indicate the number of daily updates to line items, this mainly consists of changing priority, allocation, and status (on/off). Note: because our line items are largely running separate priorities, the CPM doesn’t need to be updated in most cases, and to increase efficiency we don’t include CPM updates unless necessary.
* **Active Market Price Tests:** Periodically we re-introduce line items that have been tested out of the waterfall due to low-performance at a small allocation of traffic to see if the market dynamics have allowed for a higher tier of traffic to be purchased. This number is the number of price-tests that are active in your managed inventory.
* **Successful Price Tests:** The number of prices judged to have succeeded, and are now being ramped up in allocation (amount of traffic).
* **Failed Market Price Tests:** indicate introductions or failing performance of existing line items that are being actively ramped down in traffic, or turned off.
**Optimization Results:**
* **Managed revenue** is the total AdLibertas amount of revenue that is managed by AdLibertas.
* **Daily Cost:** is the daily cost of our measured performance increase (for more see the [cost calculation section](https://docs.adlibertas.com/getting-started/welcome-to-adlibertas)).
* **Optimization Changes:** Area chart, over time, of the number of waterfall changes AdLibertas makes to the waterfall.
* **Total Running Line Items:** Total number of running line items under AdLibertas management.
* **Optimization Tests:** total successful (blue) & failing (grey) price tests running under AdLibertas care.
Next: [Ad Network Reporting](https://docs.adlibertas.com/the-platform/dashboard-features/ad-network-reports)