> For the complete documentation index, see [llms.txt](https://docs.adlibertas.com/llms.txt). Markdown versions of documentation pages are available by appending `.md` to page URLs; this page is available as [Markdown](https://docs.adlibertas.com/the-platform/user-level-audience-reporting/report-layout/forecasting-module.md).
# Forecasting Module
{% hint style="info" %}
The Forecasting module allows you to apply earning projections on user performance, helping you anticipate future value of users.
{% endhint %}

### **What is the Forecasting module?**
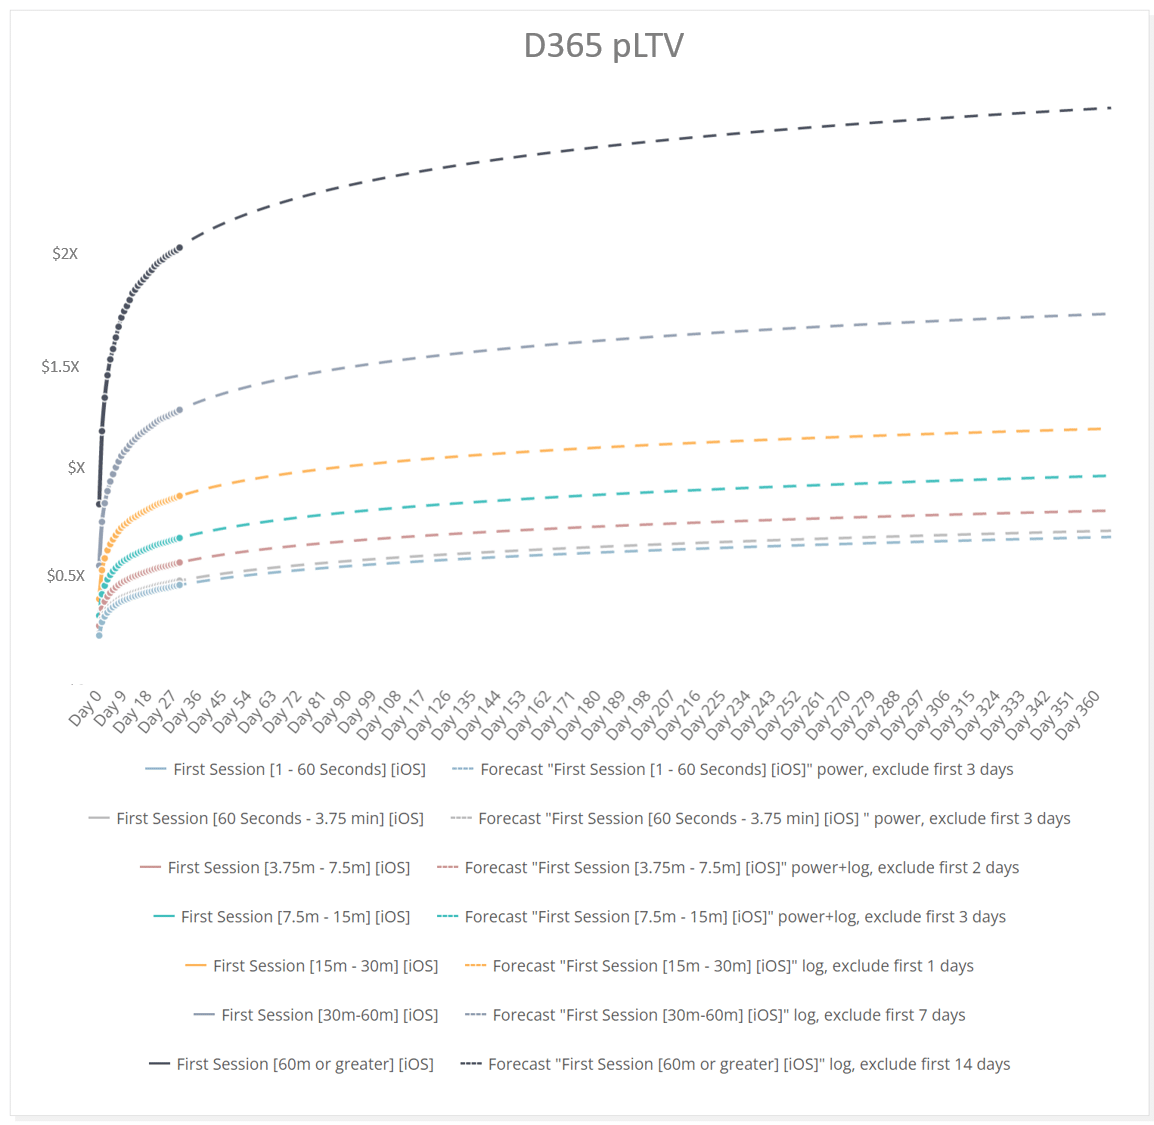
The LTV forecasting module provides a visualization of a curve of best fit over your audience’s LTV data. It provides a quick and easy way of seeing possible future values of the LTV metric, which may be useful in understanding future values of the audience LTV.
### **The Models:**
We apply several mathematical models to help you choose the curve projection that best represents your data and users. The model is calculated using your chosen LTV data and allows you to extend these models to predict future values. We currently offer 3 curves to choose from:
* **Best fit (auto):** The Best Fit model automatically cycles through the 45 projection models on your audience data and applies the model that shows the highest accuracy with the last tertile of measured performance. For example, if you are projecting LTV on a group with a 15d history, the Best Fit curve would find the model that best matches the last 5 days of history.
{% hint style="warning" %}
Disclaimer: the best fit model simply finds the best mathematical projection representation based on your audience performance. It doesn't factor into account immature or inappropriately small sample sizes. For more information see[ "What is the probability projected LTV becomes actual LTV?"](/faqs/audience-reporting/what-is-the-probability-projected-ltv-becomes-actual-ltv.md)
{% endhint %}
* **Linear**: Also called line-of-best fit, this is the most aggressive growth model and shows a straight-line growth rate. This most often occurs with a relatively flat retention curve and users are predictably returning to the app. The equation takes the form Y=aX + b. This model usually indicates very low churn and/or increasing user spend throughout their lifetime. For that reason it's relatively rarely appropriate.
* **Linear + Power:** This model averages the results of the linear and power models. This is more aggressive (higher earning) than the power curve alone but lower than the linear curve.
* **Power**: A non-linear power regression calculation. Useful when there is a skew in early user behavior (e.g. high early user drop-off). This is the most common curve as it generally applies well for apps seeing retention that models a classic exponential decay curve. The equation takes the form Y=aX^b.
* **Power + Log:** This model averages the results of Power and Logarithmic models. It provides a balance of the more fiscally conservative logarithmic curve and the more median power curve.
* **Logarithmic**: Also called exponential; this is the “most conservative” function and takes the form via a non-linear regression with a logarithmic transform. This is most useful when there is a large drop-off in retention (or profitability) in early user behavior. Takes the form Y=a\*ln(x) + b.
Depending on the nature of the data, one model may be a better fit for the data than the others. We encourage you to explore and select the one that matches your needs.
#### Related Reading:
{% embed url="" %}
{% embed url="" %}
{% embed url="" %}
### **Customizing your model: Exclusions**
When modeling LTV data for your app, it is not uncommon to [see large fluctuations in the retention or earning rates of users over the first several days to several weeks](https://www.adlibertas.com/two-event-types-you-need-for-growth-and-retention/#:~:text=The%20categories%20are,up%20the%20total.), which then settles down and tapers off into a long tail of retained users. Since projections over longer time periods rely on the long-tail (retained) of users more than the initial fluctuations, excluding noisy days upfront may lead to more reliable forecasts.
Conversely, a few mature users may adversely affect your prediction, so we offer the ability to make predictions ignoring the last days of your audience performance. In order to help you refine to only the most relevant data points, the UI offers 12 different data filters:
* **Include all data points**: Applies the prediction model using all data points starting at Day 0.
* **Exclude FIrst *****N***** days**: Excludes Day 0 through Day *N* from the projection model. Will only include all data points from Day n onward in the calculation.
* **Exclude Last *****N***** days**: If your LTV chart extends to 30d, excluding the Last *N* days would calculate your model by excluding data from 0 to 30-*N*.

To see a quick video example watch the video below:
{% embed url="" %}
#### **Related:** [**FAQ: What is the probability projected LTV becomes actual LTV?**](https://docs.adlibertas.com/faqs/audience-reporting/what-is-the-probability-projected-ltv-becomes-actual-ltv)

